
Modern distributed systems make it hard to see why a service is slow or failing. SigNoz observability gives engineering teams metrics, traces, and logs in one open source APM. That context turns a long debugging session into a direct fix.
Key points
- SigNoz is an open source APM built on OpenTelemetry and ClickHouse.
- It combines metrics, traces, and logs in a self-hosted platform.
- Engineering teams use it to reduce mean time to resolution (MTTR) and avoid proprietary APM pricing.
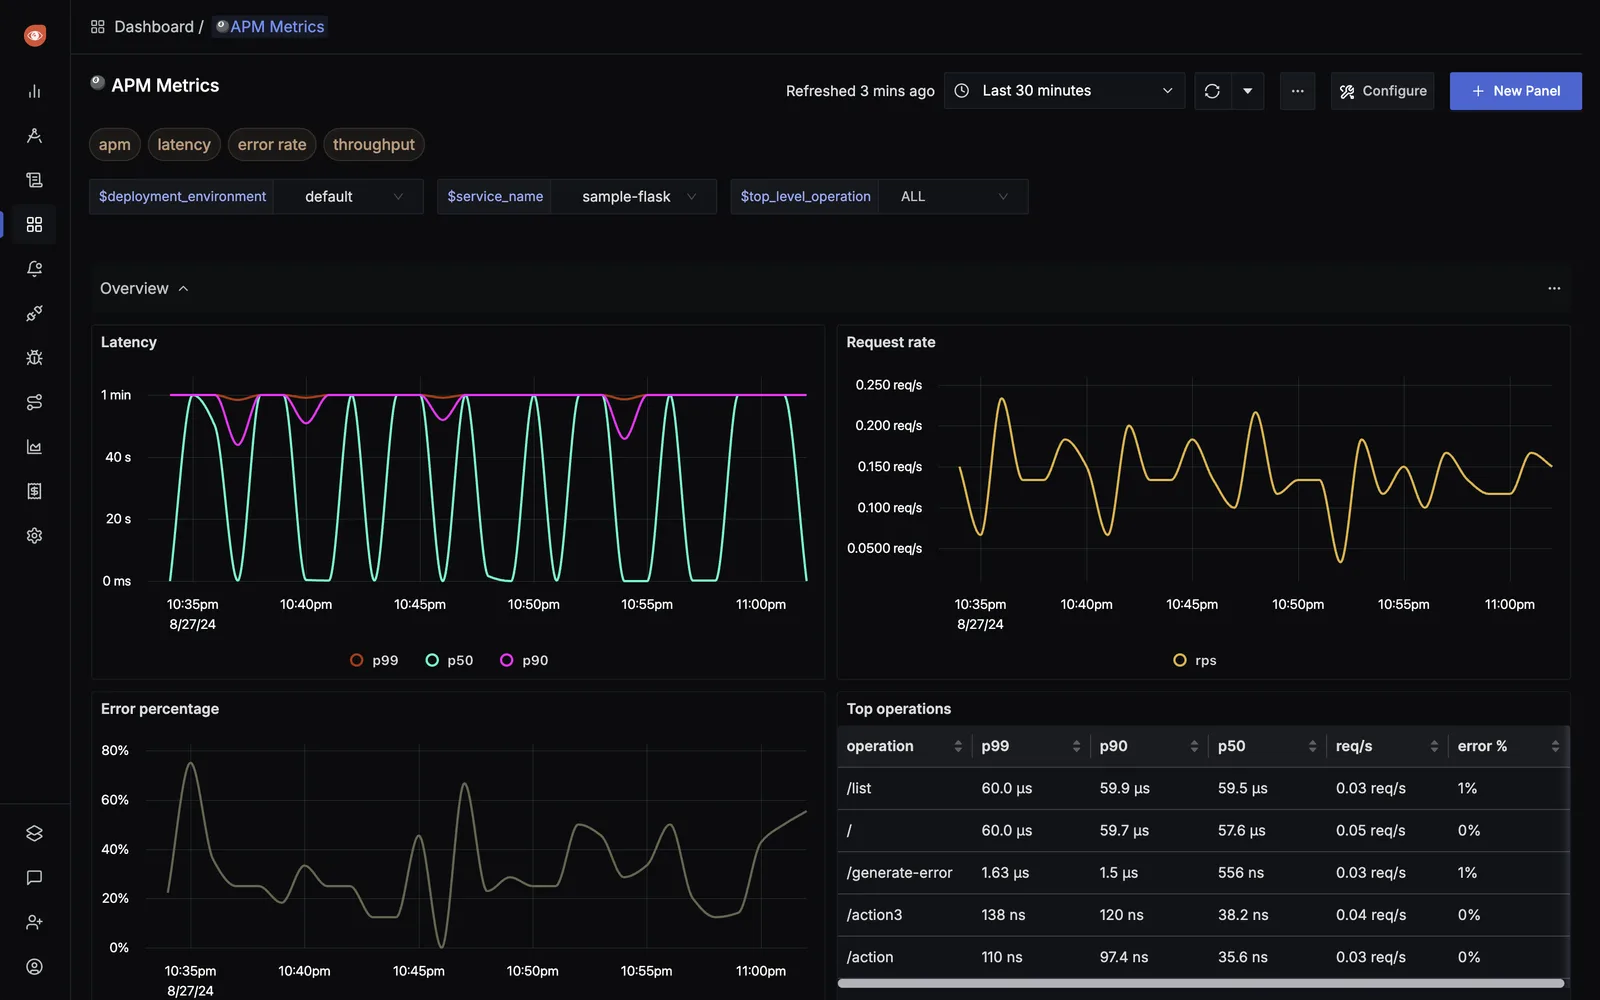
What is SigNoz observability?
SigNoz is an open source application performance monitoring (APM) platform. It is built on OpenTelemetry, a vendor-neutral standard for telemetry data, and ClickHouse, a fast columnar database. In practice, SigNoz observability means engineers can move from a high-level metric to a specific trace without switching tools.
Traditional monitoring often tells you that something is wrong. Observability adds the why: which service, which request, and which operation caused the problem. For distributed systems, that difference matters.
How does SigNoz compare to Datadog and New Relic?
SigNoz is often evaluated as an open source alternative to proprietary APM tools. The main differences are licensing, hosting, and how pricing scales.
| Capability | SigNoz | Datadog | New Relic |
|---|---|---|---|
| License | Open source | Proprietary | Proprietary |
| Hosting | Self-hosted with Docker or Kubernetes, or SigNoz Cloud | SaaS | SaaS |
| Telemetry data | Metrics, traces, logs | Metrics, traces, logs | Metrics, traces, logs |
| OpenTelemetry core | Built on OpenTelemetry | Supports OpenTelemetry | Supports OpenTelemetry |
| Cost model | No per-seat or per-GB license for the open source core | Per-host or per-GB subscription | Per-user or per-GB subscription |
What makes SigNoz stand out?
SigNoz covers the three telemetry signals teams need most: metrics, traces, and logs. Because it is OpenTelemetry-native, instrumentation is not tied to a single vendor. Because it is self-hosted, teams keep data on their own infrastructure.
Key capabilities include:
- Complete telemetry suite: metrics, traces, and logs in one platform.
- OpenTelemetry-native design: use the same instrumentation across languages and backends.
- Self-hosted control: maintain data sovereignty and reduce vendor lock-in.
- Cost predictability: avoid per-seat or per-GB commercial APM pricing.
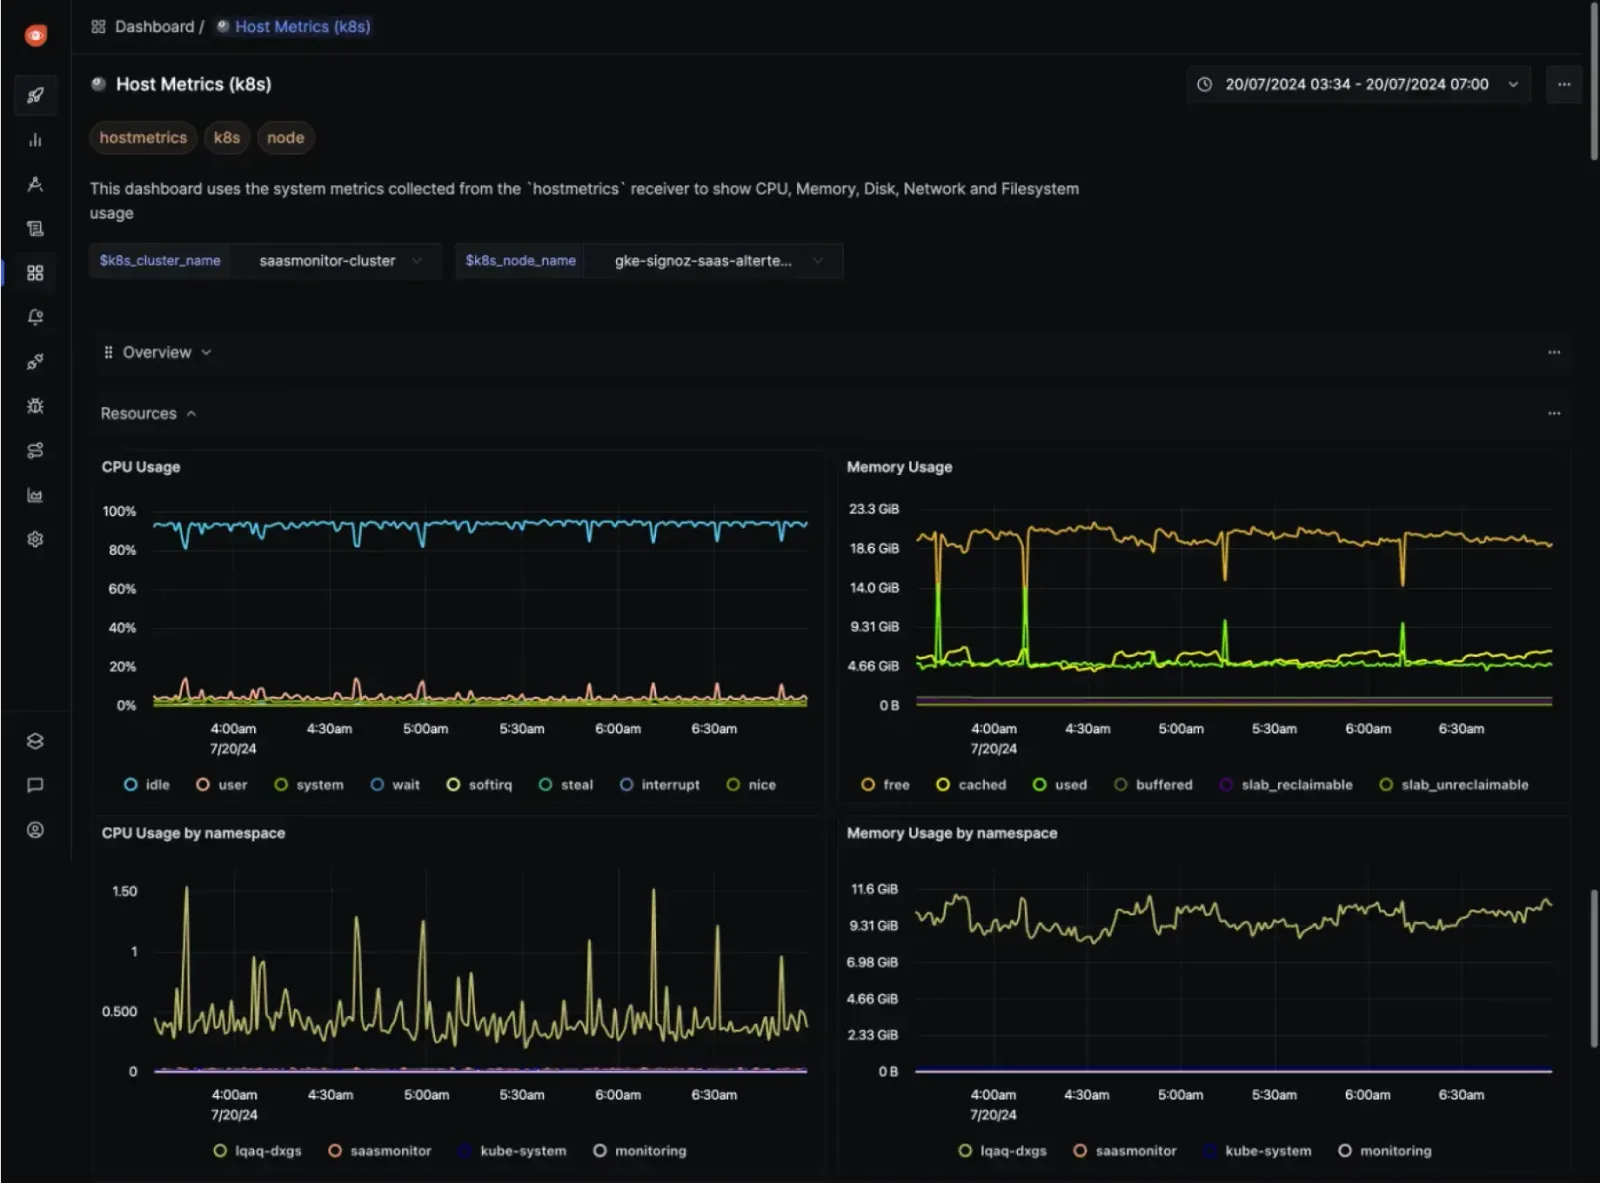
How SigNoz helps engineering teams
Performance optimization
Distributed tracing shows request flow across service boundaries. Flame graphs make slow components visible, whether the cause is a slow database query, an external API call, or an inefficient algorithm.
Error detection and root cause analysis
SigNoz provides context around failures. Engineers can correlate error-rate spikes with deployment events, configuration changes, or unusual traffic patterns. Drill-down from aggregate metrics to individual request traces reduces debugging time.
Service level objective monitoring
Teams can define and track service level objectives (SLOs) and error budgets. This shifts reliability work from reactive firefighting to monitoring against customer expectations.
Faster debugging workflows
SigNoz reduces the gap between issue identification and resolution by showing rich context about application behavior. Engineers spend less time reproducing issues and more time building features.
Cross-team collaboration
Platform, frontend, and backend teams can share the same dashboards. Product managers can use those dashboards when discussing performance with engineers.
Data-driven engineering decisions
Telemetry data helps engineering leaders prioritize optimization work based on customer impact rather than hunches.
How does SigNoz observability work?
Applications send telemetry through OpenTelemetry to the SigNoz backend. ClickHouse stores that data, and dashboards and alerts consume it. This path keeps instrumentation separate from storage and presentation.
Getting started with SigNoz
SigNoz can be deployed with Docker Compose or Kubernetes. OpenTelemetry instrumentation libraries support JavaScript, Python, Java, Go, and other major languages.
Implementation roadmap:
- Deploy the SigNoz backend with Docker Compose or Kubernetes.
- Instrument applications with OpenTelemetry SDKs.
- Configure basic dashboards for key services.
- Set alerts for critical performance thresholds.
- Expand observability coverage across the stack gradually.
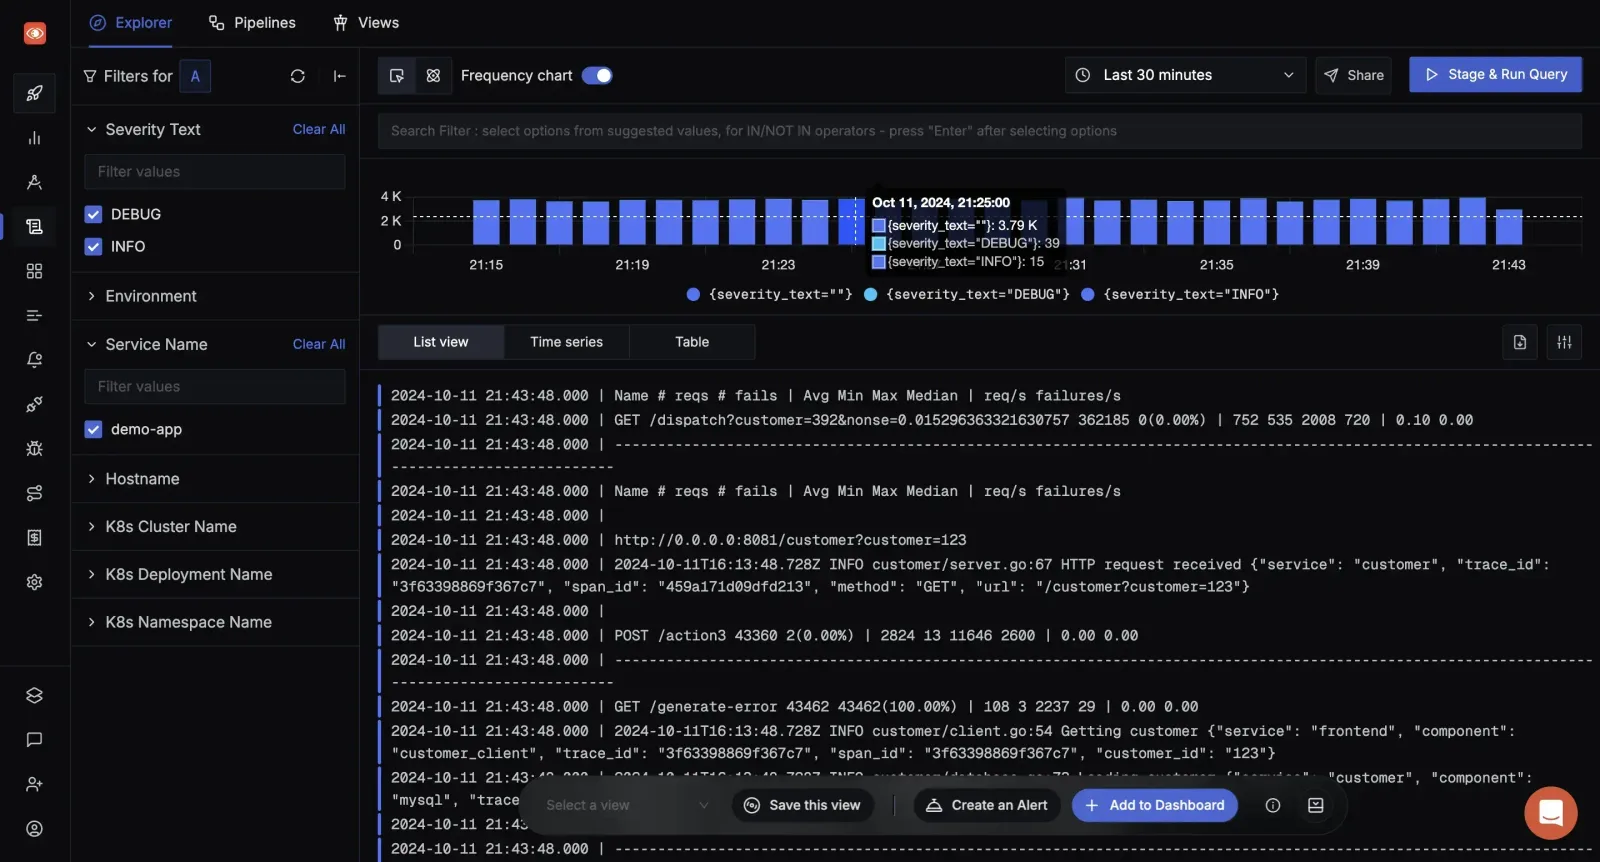
Business case for SigNoz observability
Reduced mean time to resolution
Teams with proper observability resolve issues faster. For customer-facing applications, that directly affects user satisfaction and retention.
Lower total cost of ownership
A self-hosted open source core avoids expensive per-gigabyte or per-host commercial APM pricing. That matters as telemetry data volume grows.
Better developer experience
Engineers with quality observability tools spend less time reproducing issues and more time shipping features. That improves productivity and helps retention.
FAQ
Is SigNoz open source?
Yes. SigNoz is an open source APM platform built on OpenTelemetry and ClickHouse, and it can be self-hosted.
How does SigNoz compare to Datadog?
SigNoz provides metrics, traces, and logs with an open source, self-hosted core. Datadog is proprietary and usually delivered as a SaaS subscription, though it supports similar telemetry data.
What languages does SigNoz support?
SigNoz uses OpenTelemetry SDKs, which support major languages including JavaScript, Python, Java, and Go.